← Back to Projects
// class project · SI305

Physician Density and Socioeconomic Disparities in Michigan ZIP Codes

Physicians in Michigan tend to practice in wealthier areas, leaving low-income communities underserved. Using 31 years of NaNDA data, I examined how physician density has shifted across income groups from 1990 to 2021 — and identified which demographic factors most strongly predict where physicians do and don't practice.

Python Pandas SciPy NaNDA Statistical Analysis
2x

The physician density gap between the highest and lowest income quartiles doubled over the 31-year period — low-income communities fell further behind, not closer.

r = 0.23

Median family income was the strongest predictor of physician density among all demographic variables tested, significant at p < 0.001.

31 yrs

Analysis spans 1990–2021 across Michigan ZIP codes, capturing long-term structural trends rather than a single snapshot.

// background

The Problem

Access to healthcare in the United States is not distributed equally. Research has consistently shown that physicians concentrate in wealthier areas — one study found 31% more primary care physicians in the highest-income counties compared to the lowest. Low-income communities face compounding barriers: limited insurance coverage, lower Medicaid reimbursement rates that reduce physician incentive to practice there, and greater reliance on emergency rooms for basic care. Michigan's chief medical officer has directly named physician maldistribution as a core access problem. This project uses ZIP-code-level data to quantify exactly how severe that maldistribution is — and which communities bear the most risk.

// research question 1

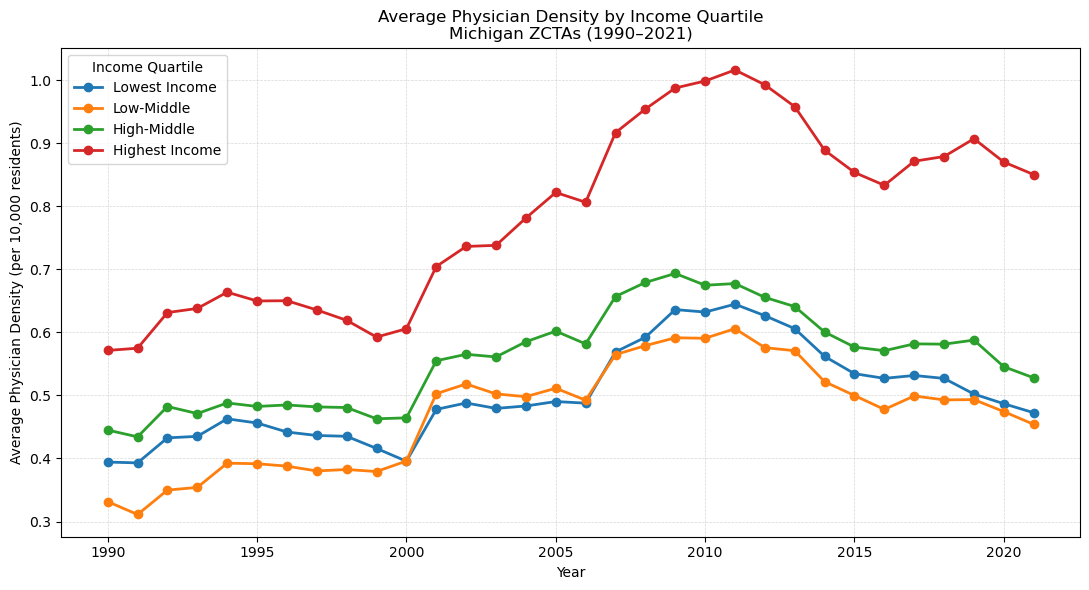
How has physician density changed across income groups from 1990 to 2021?

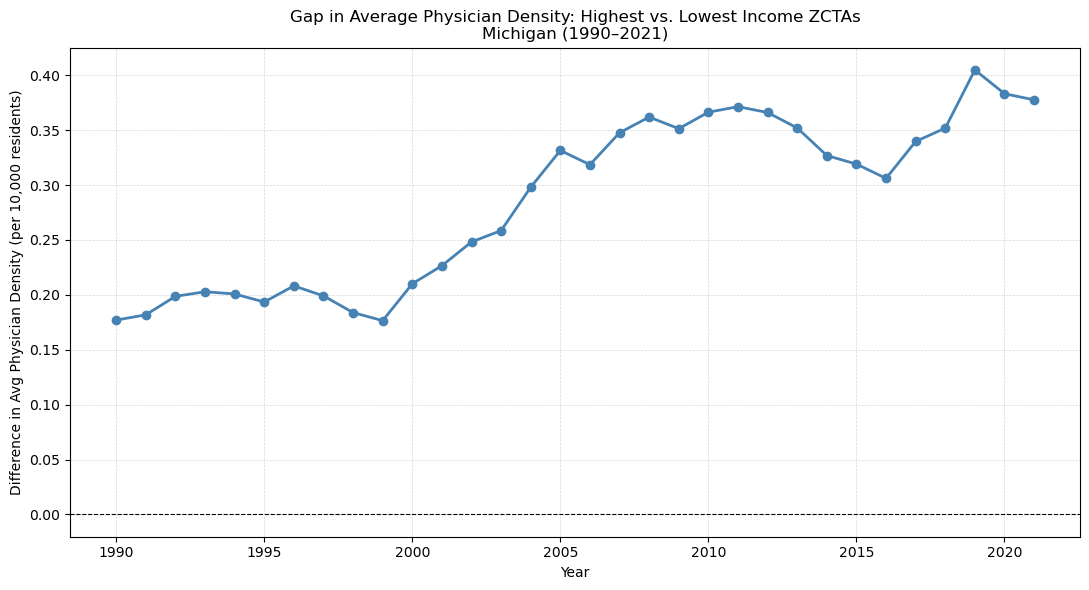
ZIP codes were grouped into four income quartiles using median family income from the NaNDA socioeconomic dataset. Average physician density was calculated for each quartile across every year from 1990 to 2021. Highest-income ZIP codes had consistently greater physician density throughout the entire period. All four groups rose together from around 2000 to 2011, then declined after 2011. Importantly, low-income ZIP codes actually had more physicians per capita in 2021 than in 1990 — the gap widened because high-income areas gained physicians faster, not because low-income areas lost them. A closer look at the spread between the top and bottom quartiles shows it doubled over the period, narrowing from 2013 to 2016 before widening again and peaking in 2019. One methodological note: averages are unweighted across ZCTAs, giving equal weight to a ZIP code with 500 residents and one with 50,000. A population-weighted version could tell a different story, particularly for the smallest and most rural ZCTAs.

Average physician density by income quartile, 1990–2021
Average physician density per 10,000 residents across Michigan ZIP codes, grouped by income quartile (1990–2021)
Gap in physician density between highest and lowest income quartiles
Difference in average physician density (per 10,000 residents) between the highest and lowest income quartiles, Michigan ZIP codes, 1990–2021. Higher values indicate a larger gap favoring high-income areas.
// research question 2

Which demographic factors most strongly predict low physician density?

To identify the strongest predictors, Pearson r correlation coefficients were calculated for five variables: poverty rate, median family income, disadvantage index, proportion Hispanic, and proportion non-Hispanic Black — each tested independently against physician density. Median family income had the strongest positive correlation (r = 0.23), followed by proportion non-Hispanic Black (r = 0.17). Both were statistically significant at p < 0.001. Poverty rate and the disadvantage index showed near-zero correlations with physician density on their own — not because they overlap with each other (that would matter in a regression, not in separate correlations), but simply because they are weak individual predictors of where physicians practice. The finding around race was unexpected — but likely reflects the concentration of Black residents in urban areas like Detroit, Flint, and Lansing, which happen to host large hospital systems. The scatter plot reinforces this: most ZCTAs cluster near zero regardless of income, with a handful of high-density outliers spiking to 5–7 physicians per 10,000 residents. Those outliers appear across all income levels, suggesting they represent ZCTAs that contain hospitals or medical centers rather than a clean income effect. The most important untested explanation is urban vs. rural location: adding population density as a control, or splitting the analysis by urbanicity, would directly test whether the income pattern holds once geography is accounted for.

Correlation between demographic predictors and physician density
Pearson r correlation between demographic predictors and physician density per 10,000 residents, Michigan ZIP codes (2021). Y-axis shows raw dataset variable codes: PPOV = poverty rate, DISADVANTAGE = composite disadvantage index, MFI = median family income, PHISP = proportion Hispanic, PNHBLK = proportion non-Hispanic Black.
Median family income vs physician density scatter plot
Median family income vs. physician density per 10,000 residents across Michigan ZIP codes (2021)
// recommendations

What Should Change

Michigan Dept. of Health & Human Services

Loan Repayment Incentives for Physicians in Low-Income ZIP Codes

The 31-year widening gap and the income correlation both point to the same root cause: financial incentives pull physicians toward wealthier areas. A Michigan-specific loan repayment program targeting low-income ZIP codes would directly counter that incentive — more targeted than existing federal HRSA programs, which apply broadly to federally designated shortage areas rather than the specific Michigan communities most affected.

Michigan Legislature

Subsidized Telehealth Access in Underserved Communities

Attracting physicians to low-income ZIP codes is a long-term challenge. In the near term, the Michigan Legislature should fund subsidized telehealth subscriptions or devices for residents in underserved areas — giving them access to preventive and routine care before conditions worsen, reducing emergency room reliance, and bridging the gap while structural reforms take effect.

// methodology

Methodology

Data Source NaNDA Healthcare Services & Socioeconomic datasets (University of Michigan ISR / ICPSR)
Tools Python, Pandas, SciPy, Matplotlib
Time Range 1990–2021 (RQ1) · 2021 cross-section (RQ2)
Methods Income quartile grouping, longitudinal trend analysis, Pearson r correlation
Unit of Analysis Michigan ZIP Code Tabulation Areas (ZCTAs)
Sample 939 of 987 ZCTAs after merge (48 dropped); distribution of dropped ZCTAs across income and region not formally tested
View Full Notebook on GitHub →