 Tap to open interactive dashboard →
User behavior analysis is central to product and growth decisions — yet the difference between new and returning users is often oversimplified. This project digs into GA4 ecommerce data from the Google Merchandise Store to quantify exactly how these two groups differ across conversion, revenue, and acquisition. As someone drawn to understanding what drives user behavior, I wanted to move beyond surface-level traffic metrics and uncover what the data actually reveals.
Tap to open interactive dashboard →
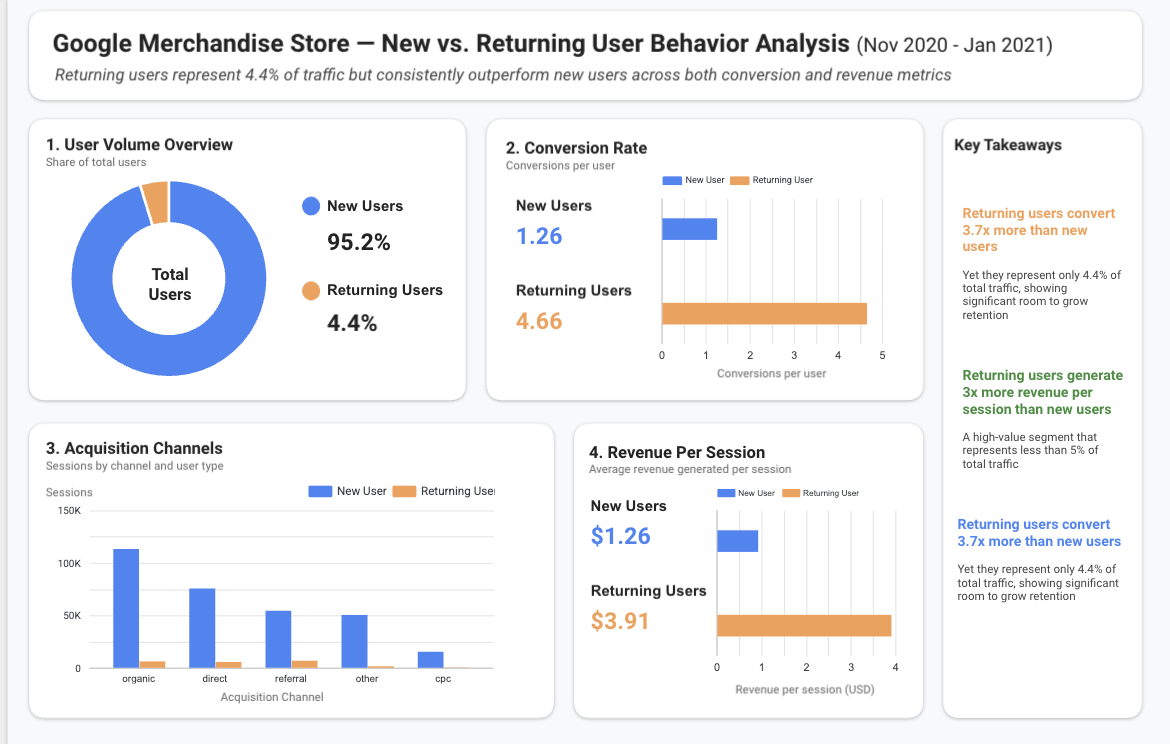
Returning users convert 3.7x more than new users — yet they represent only 4.4% of total traffic, suggesting significant room to grow retention.
Returning users generate 3x more revenue per session than new users — a high-value segment that represents less than 5% of total traffic.
Organic is the dominant acquisition channel across all user types — with the highest session volume by far, it represents the most scalable path to growth.